

Analytics
Turn your data into a competitive advantage.
Mercury Analytics gives you visibility across sales, delivery, and operations, so you can act sooner, improve performance, and run a more predictable, profitable business.
How healthy is your pipeline right now?
Which roles are genuinely progressing, and which are quietly stalling?
Where is value building, and where is it leaking away?
Management becomes simpler when everything is visible.

A single, trusted view of your operation
From individual consultant activity through to team, office, and business-wide performance.
Data you can trust
Powered by live data, so you can make faster, more effective decisions.
.png)
Suite of ready-made dashboards
Covering recruiter productivity, vacancy performance, pipeline health, fees, and forecasting.
Your team can drill into the detail
Filter by brand, geography, team, consultant, or time period, to uncover what's really driving performance and results.
Analysing your data just got a whole lot easier...
Activities & Performance
Consultant Dashboard
Gives a high-level view of every stage , bringing vacancies, placements, KPIs, and activity metrics into one actionable workspace.
Which live deals will land in the next 14 days and which ones need action today to stop them slipping?
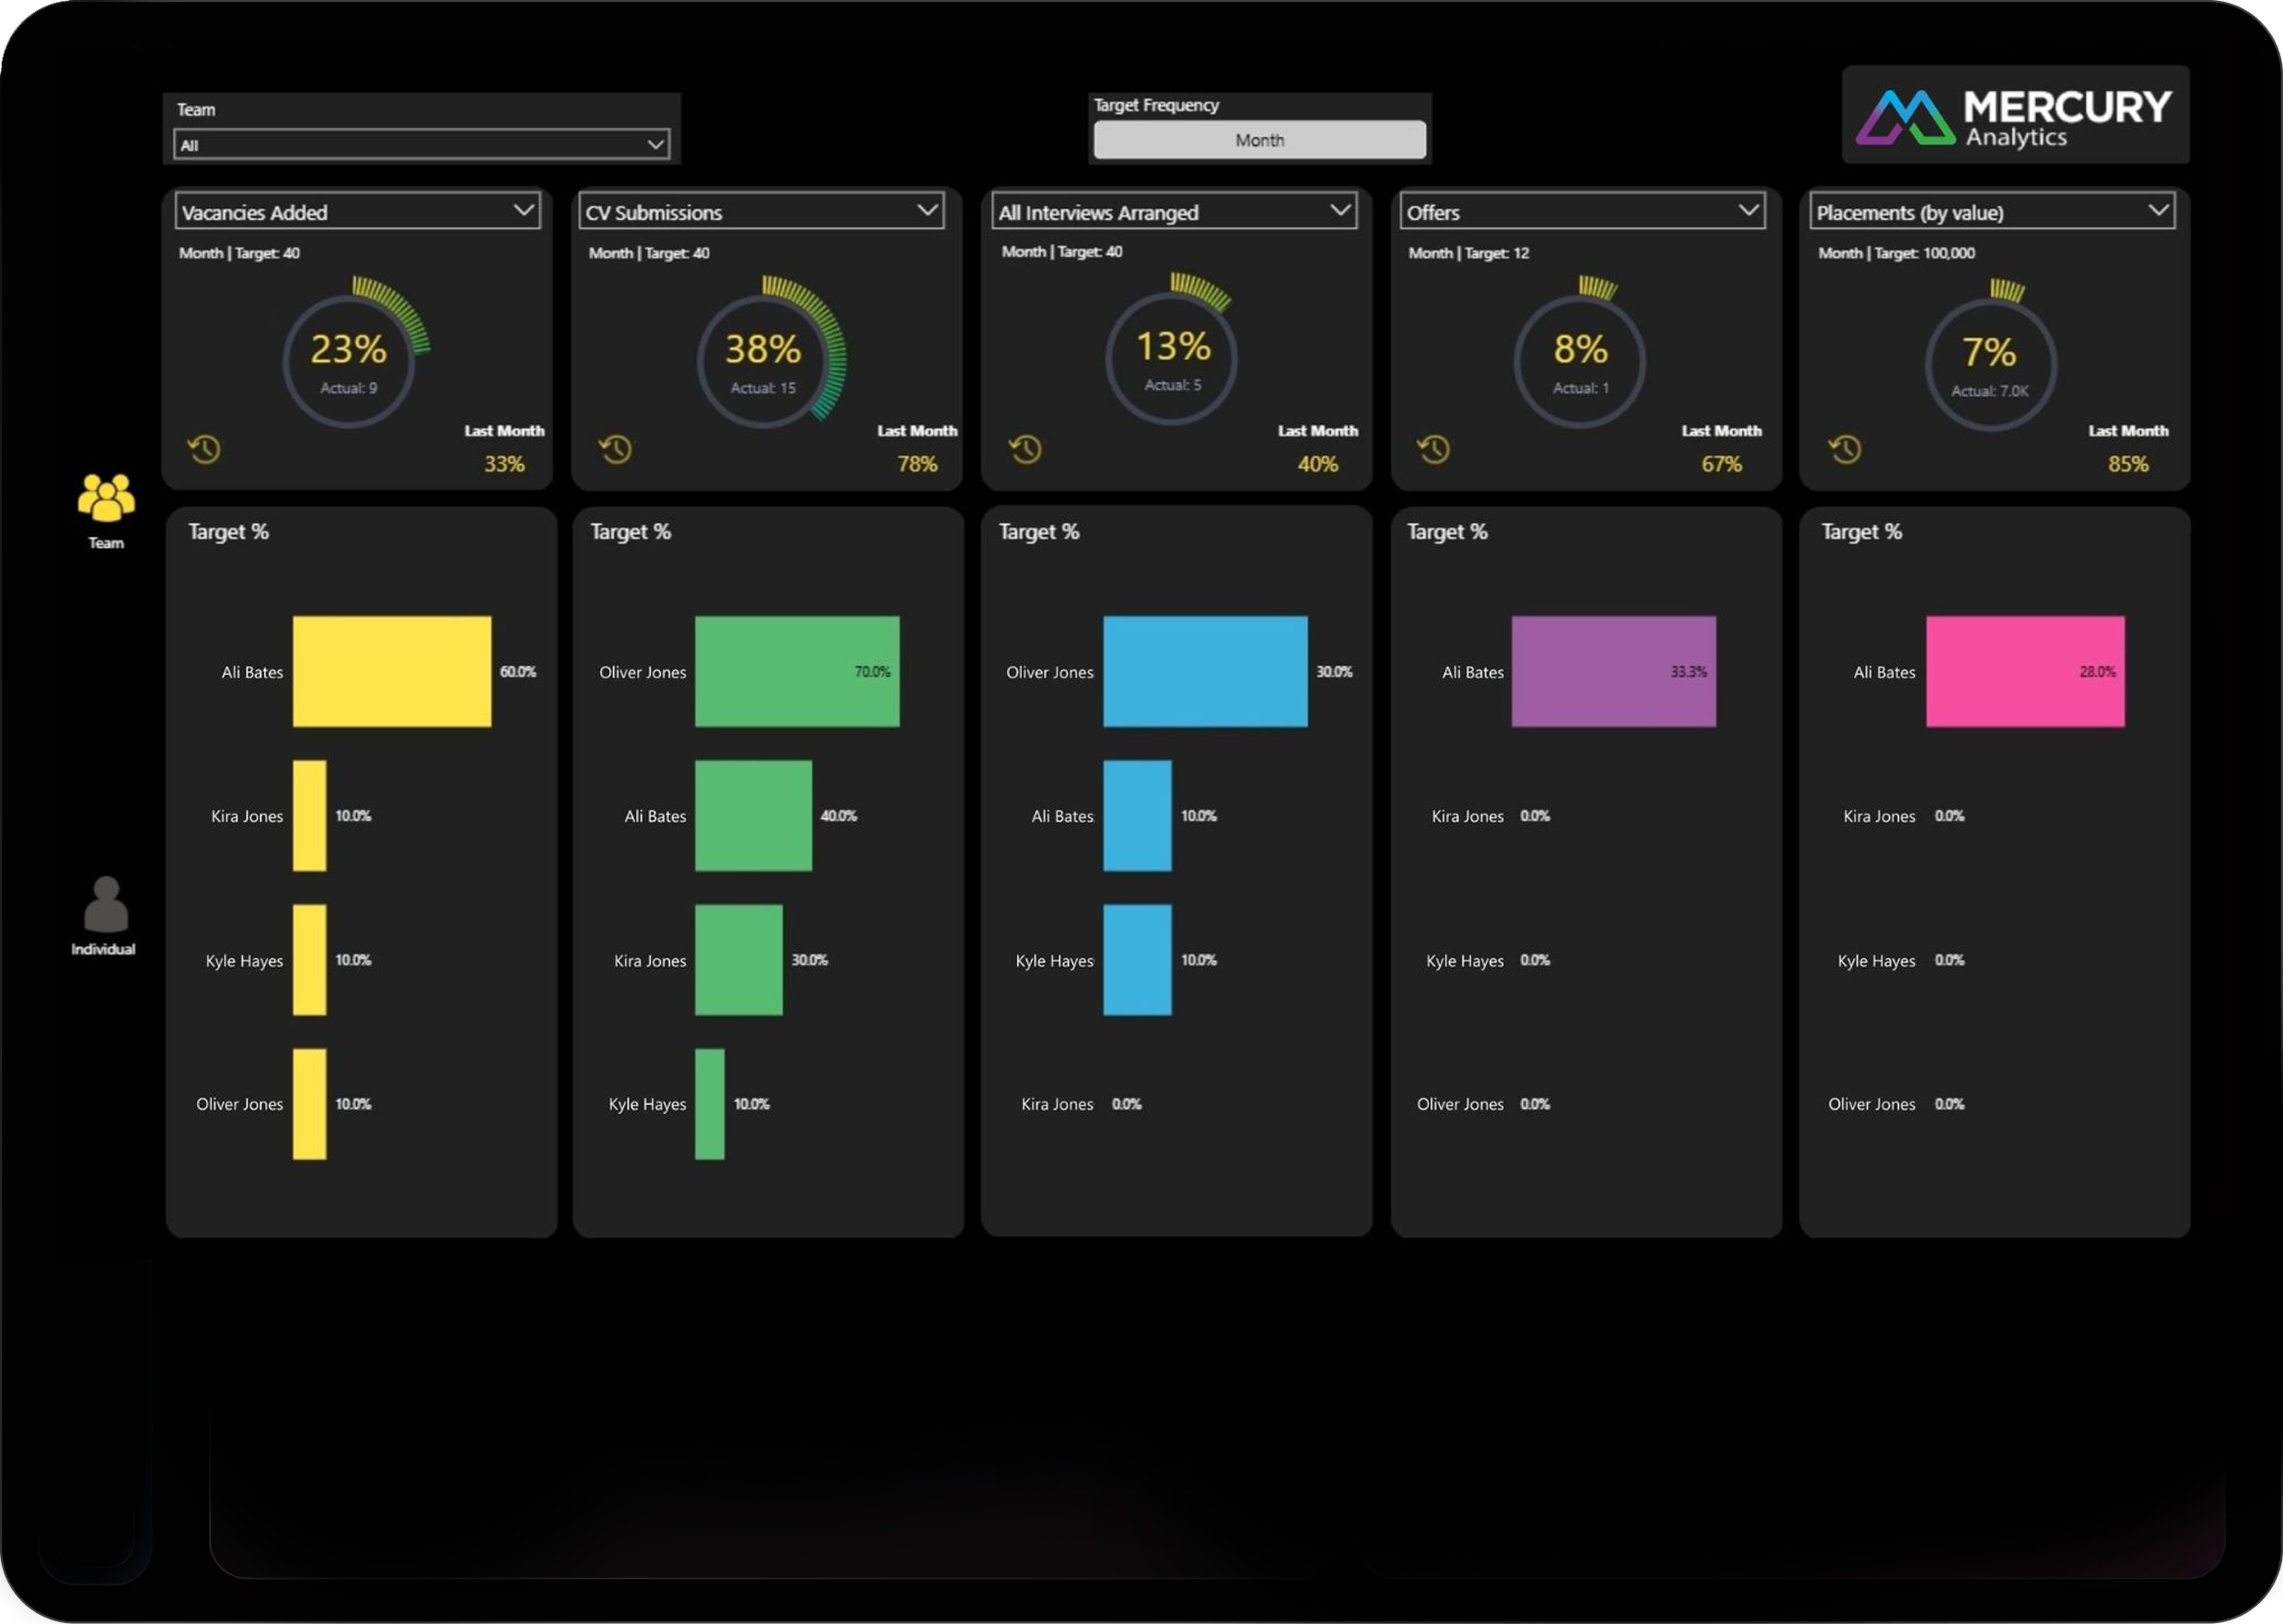
Managers Performance vs Target (Team view)
Gives leaders a powerful, data-rich view of how consultants and teams are performing against over 20 KPIs.
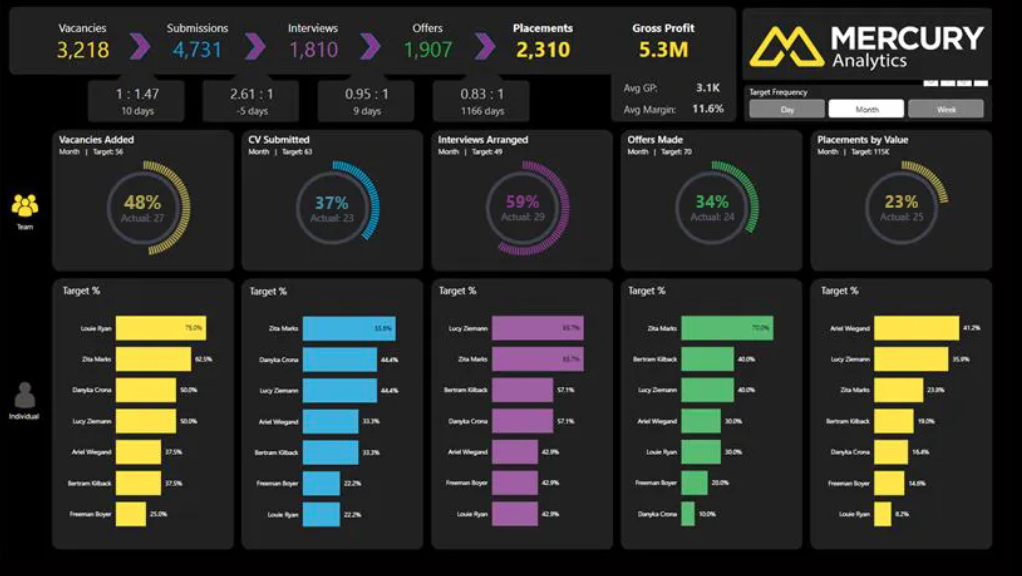
Which teams are at risk of missing revenue and what bottle necks are causing under performance?
Managers Performance vs Target Individual view
Shows how each consultant is performing across over 20 KPIs including pipeline health, activity focus, and upcoming risks.
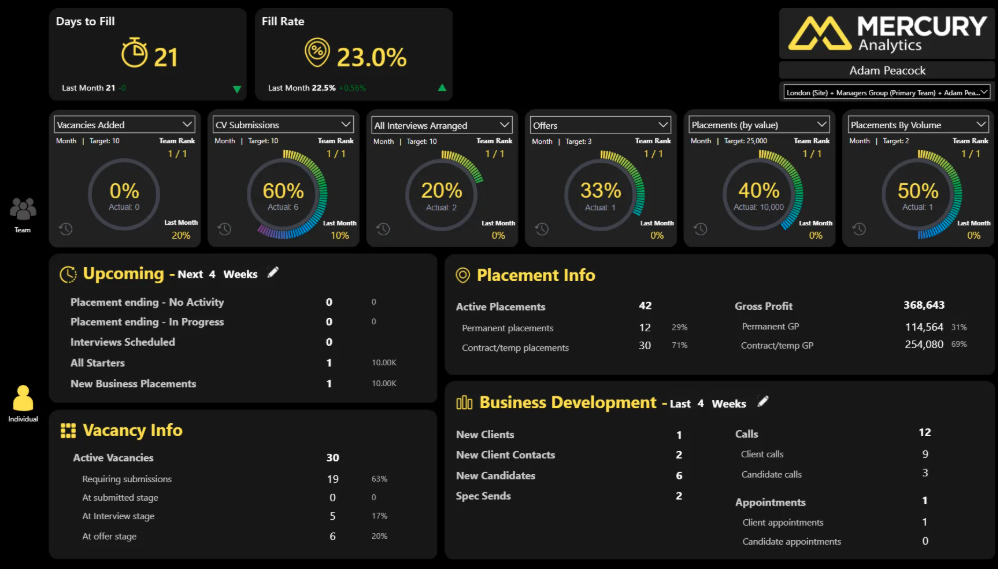
Which consultant’s activity looks healthy on the surface but is masking slow fill rates or weak conversion?
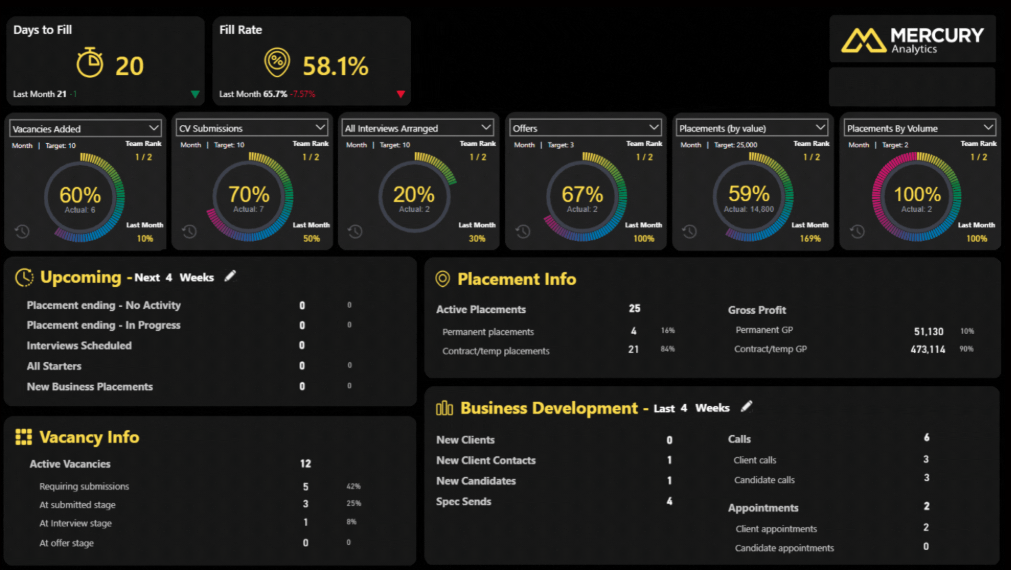
Individual Hub
See the numbers driving performance. Find the hot spots early, improve forecasting, and prevent delays that impact GP.
Where is revenue being generated and lost in the business and where do I need to provide support before we miss out?
Team Leaderboard Report
Gives leaders a clear, comparative view of team and individual performance across both recruitment and BD activity.
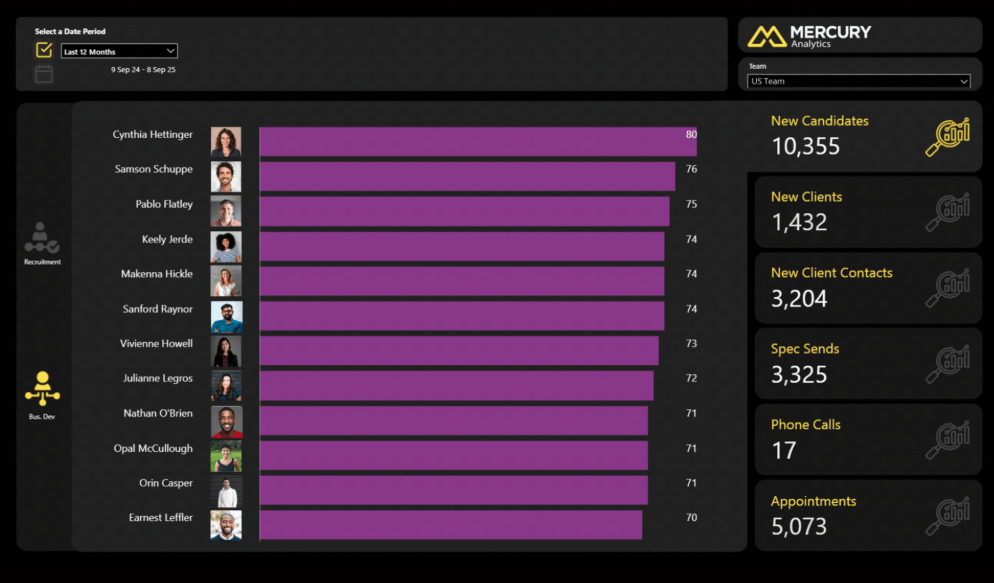
Which behaviours separate top billers from average performers?
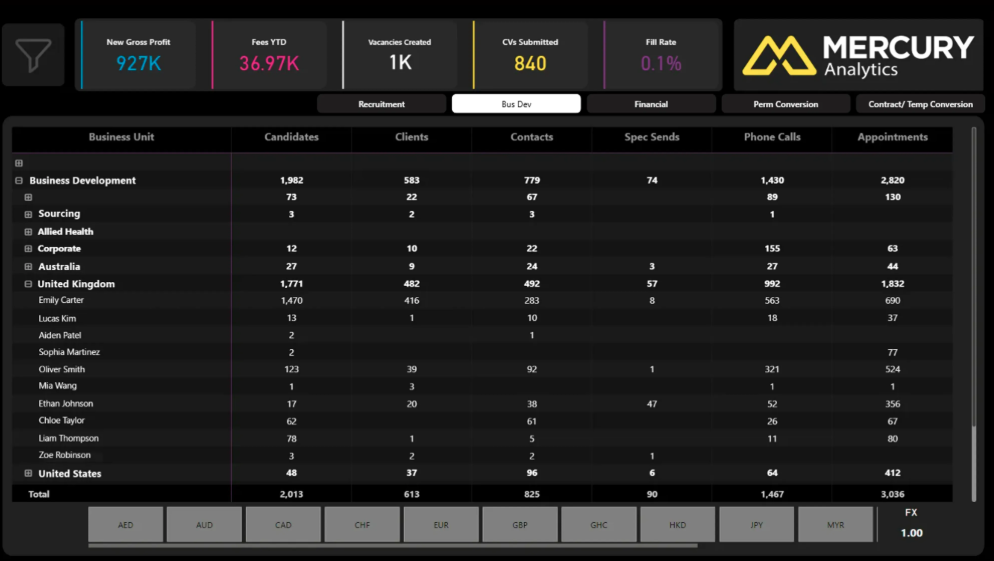
Client Interactions Report
Shows consultants how effectively they’re engaging with each client, helping them strengthen relationships and protect revenue.
Which client relationships are stalling due to declining contact frequency and where can consultants focus engagement before revenue drops?
Activities Report
Shows key recruitment and business development activities to monitor and drive performance across your business.
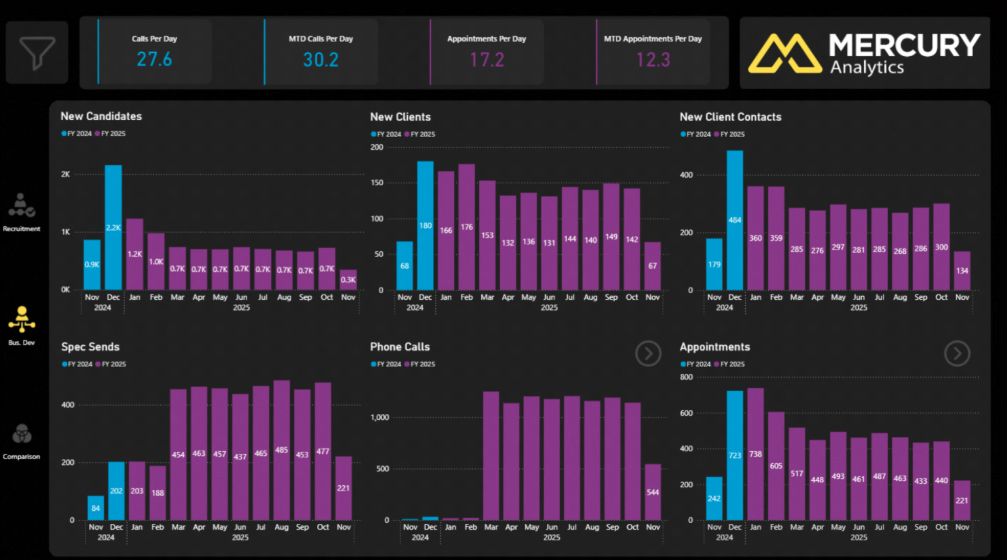
Which parts of the funnel should you concentrate on to be most effective?
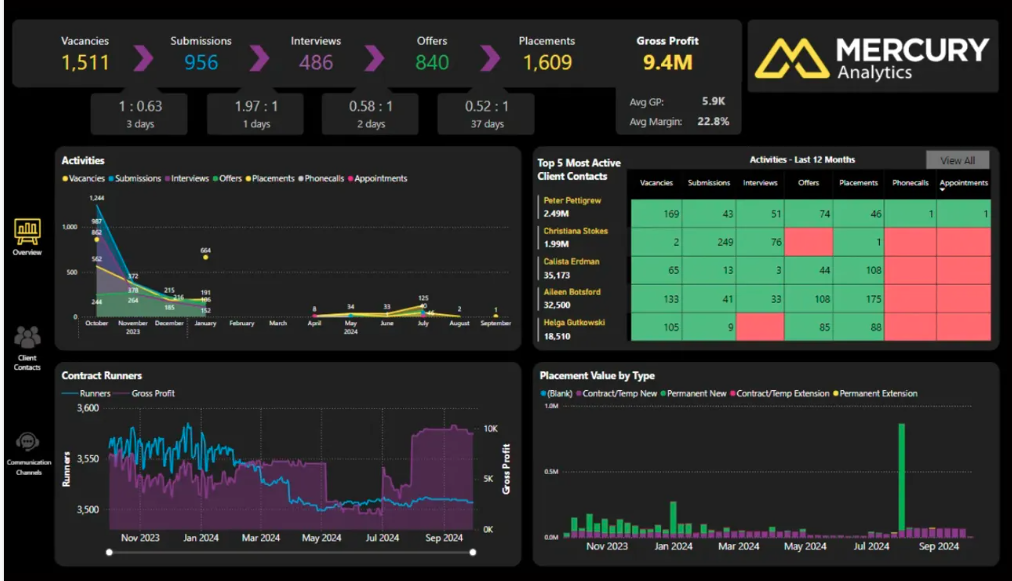
Recruitment Overview Report
Provides a complete, real-time picture of vacancy and placement performance, showing how day-to-day activity drives GP.
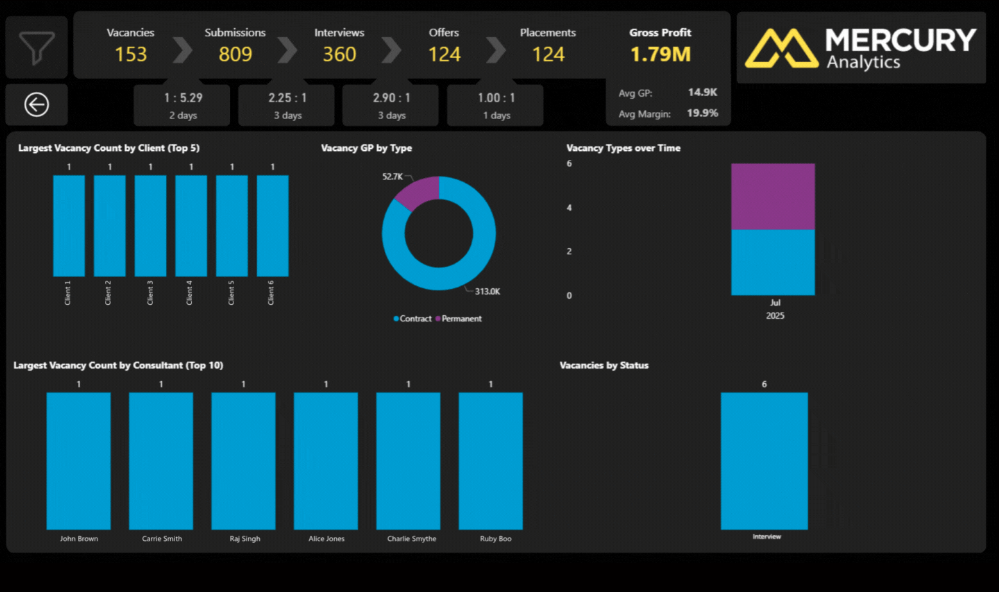
Which upcoming placements and runners are protecting next month’s revenue and which ones are at risk today?
Vacancies & Placements
Pipeline Velocity Report
Shows how efficiently candidates move through the funnel, highlighting the true speed and health of both individual and team performance.
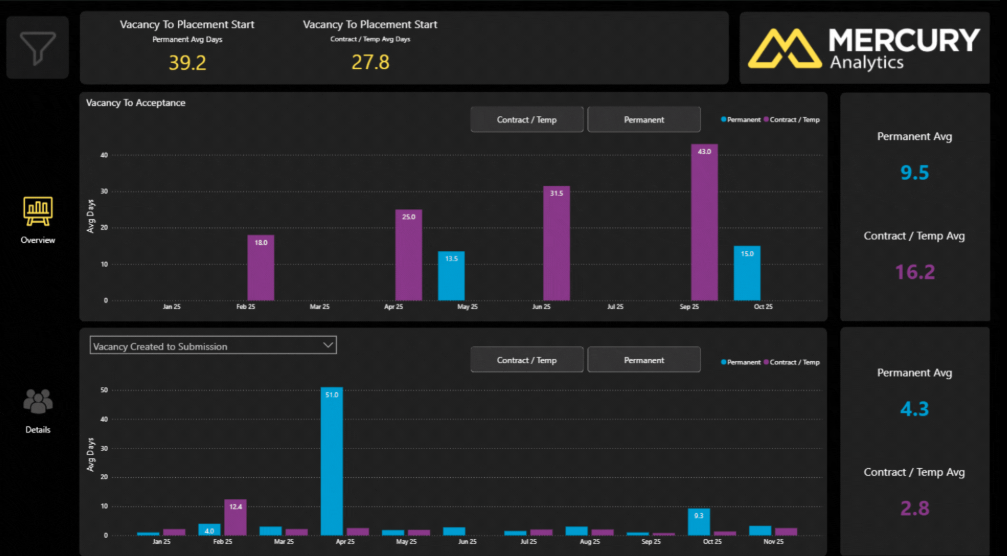
Where are pipeline delays hurting cash flow and what can we fix now to accelerate time to hire?
Vacancy Overview Report
Highlights roles that haven’t yet received CVs, enabling managers to intervene early and keep clients engaged while improving conversion and placement rates.
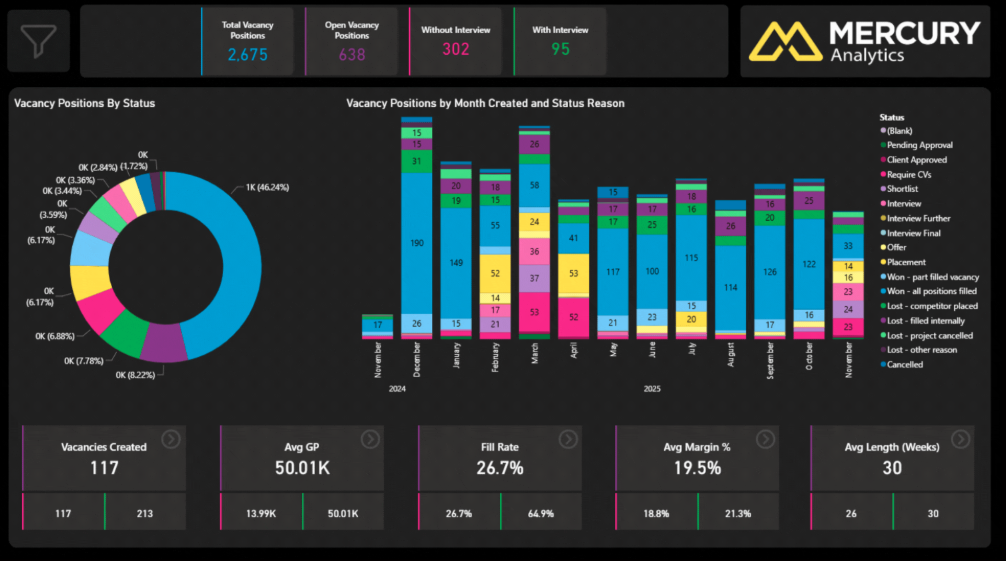
Which live roles are most likely to fail due to inactivity or lack of submissions and need immediate intervention?
Permanent Overview Report
Understand permanent recruitment performance across sites and teams while spotting early signals of market change. Identify lost revenue and high-impact clients to take action that protects profitability.
How much GP is being lost and which clients, consultants or placements pose the greatest risk going forward?
Placement Value Report
Gives senior leaders a clear, accurate view of the financial performance behind every placement.
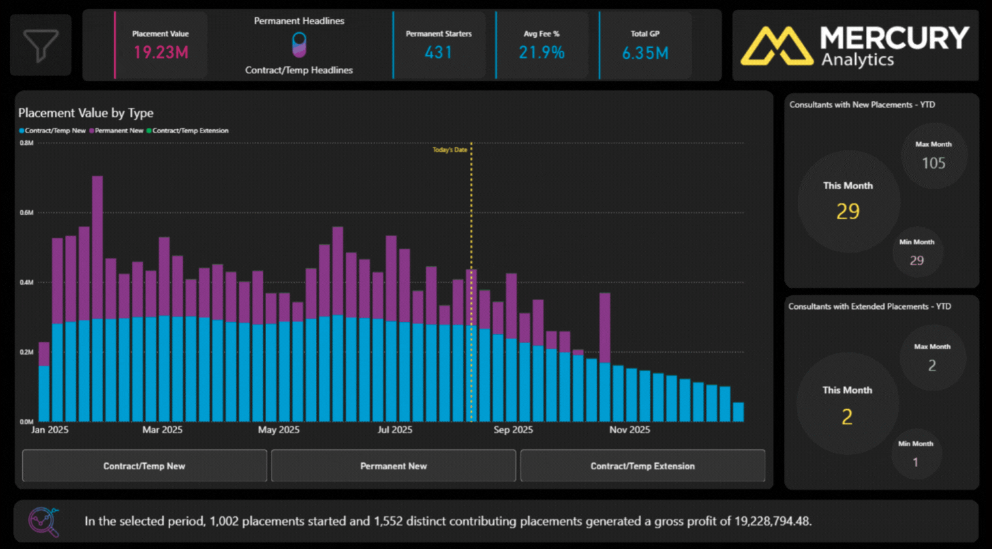
Which placements look successful but are quietly diluting margin?
Financial & Forecasting
Financial Overview Report
See revenue performance clearly across focused dashboards. Understand, track, and optimise every part of the financial engine.
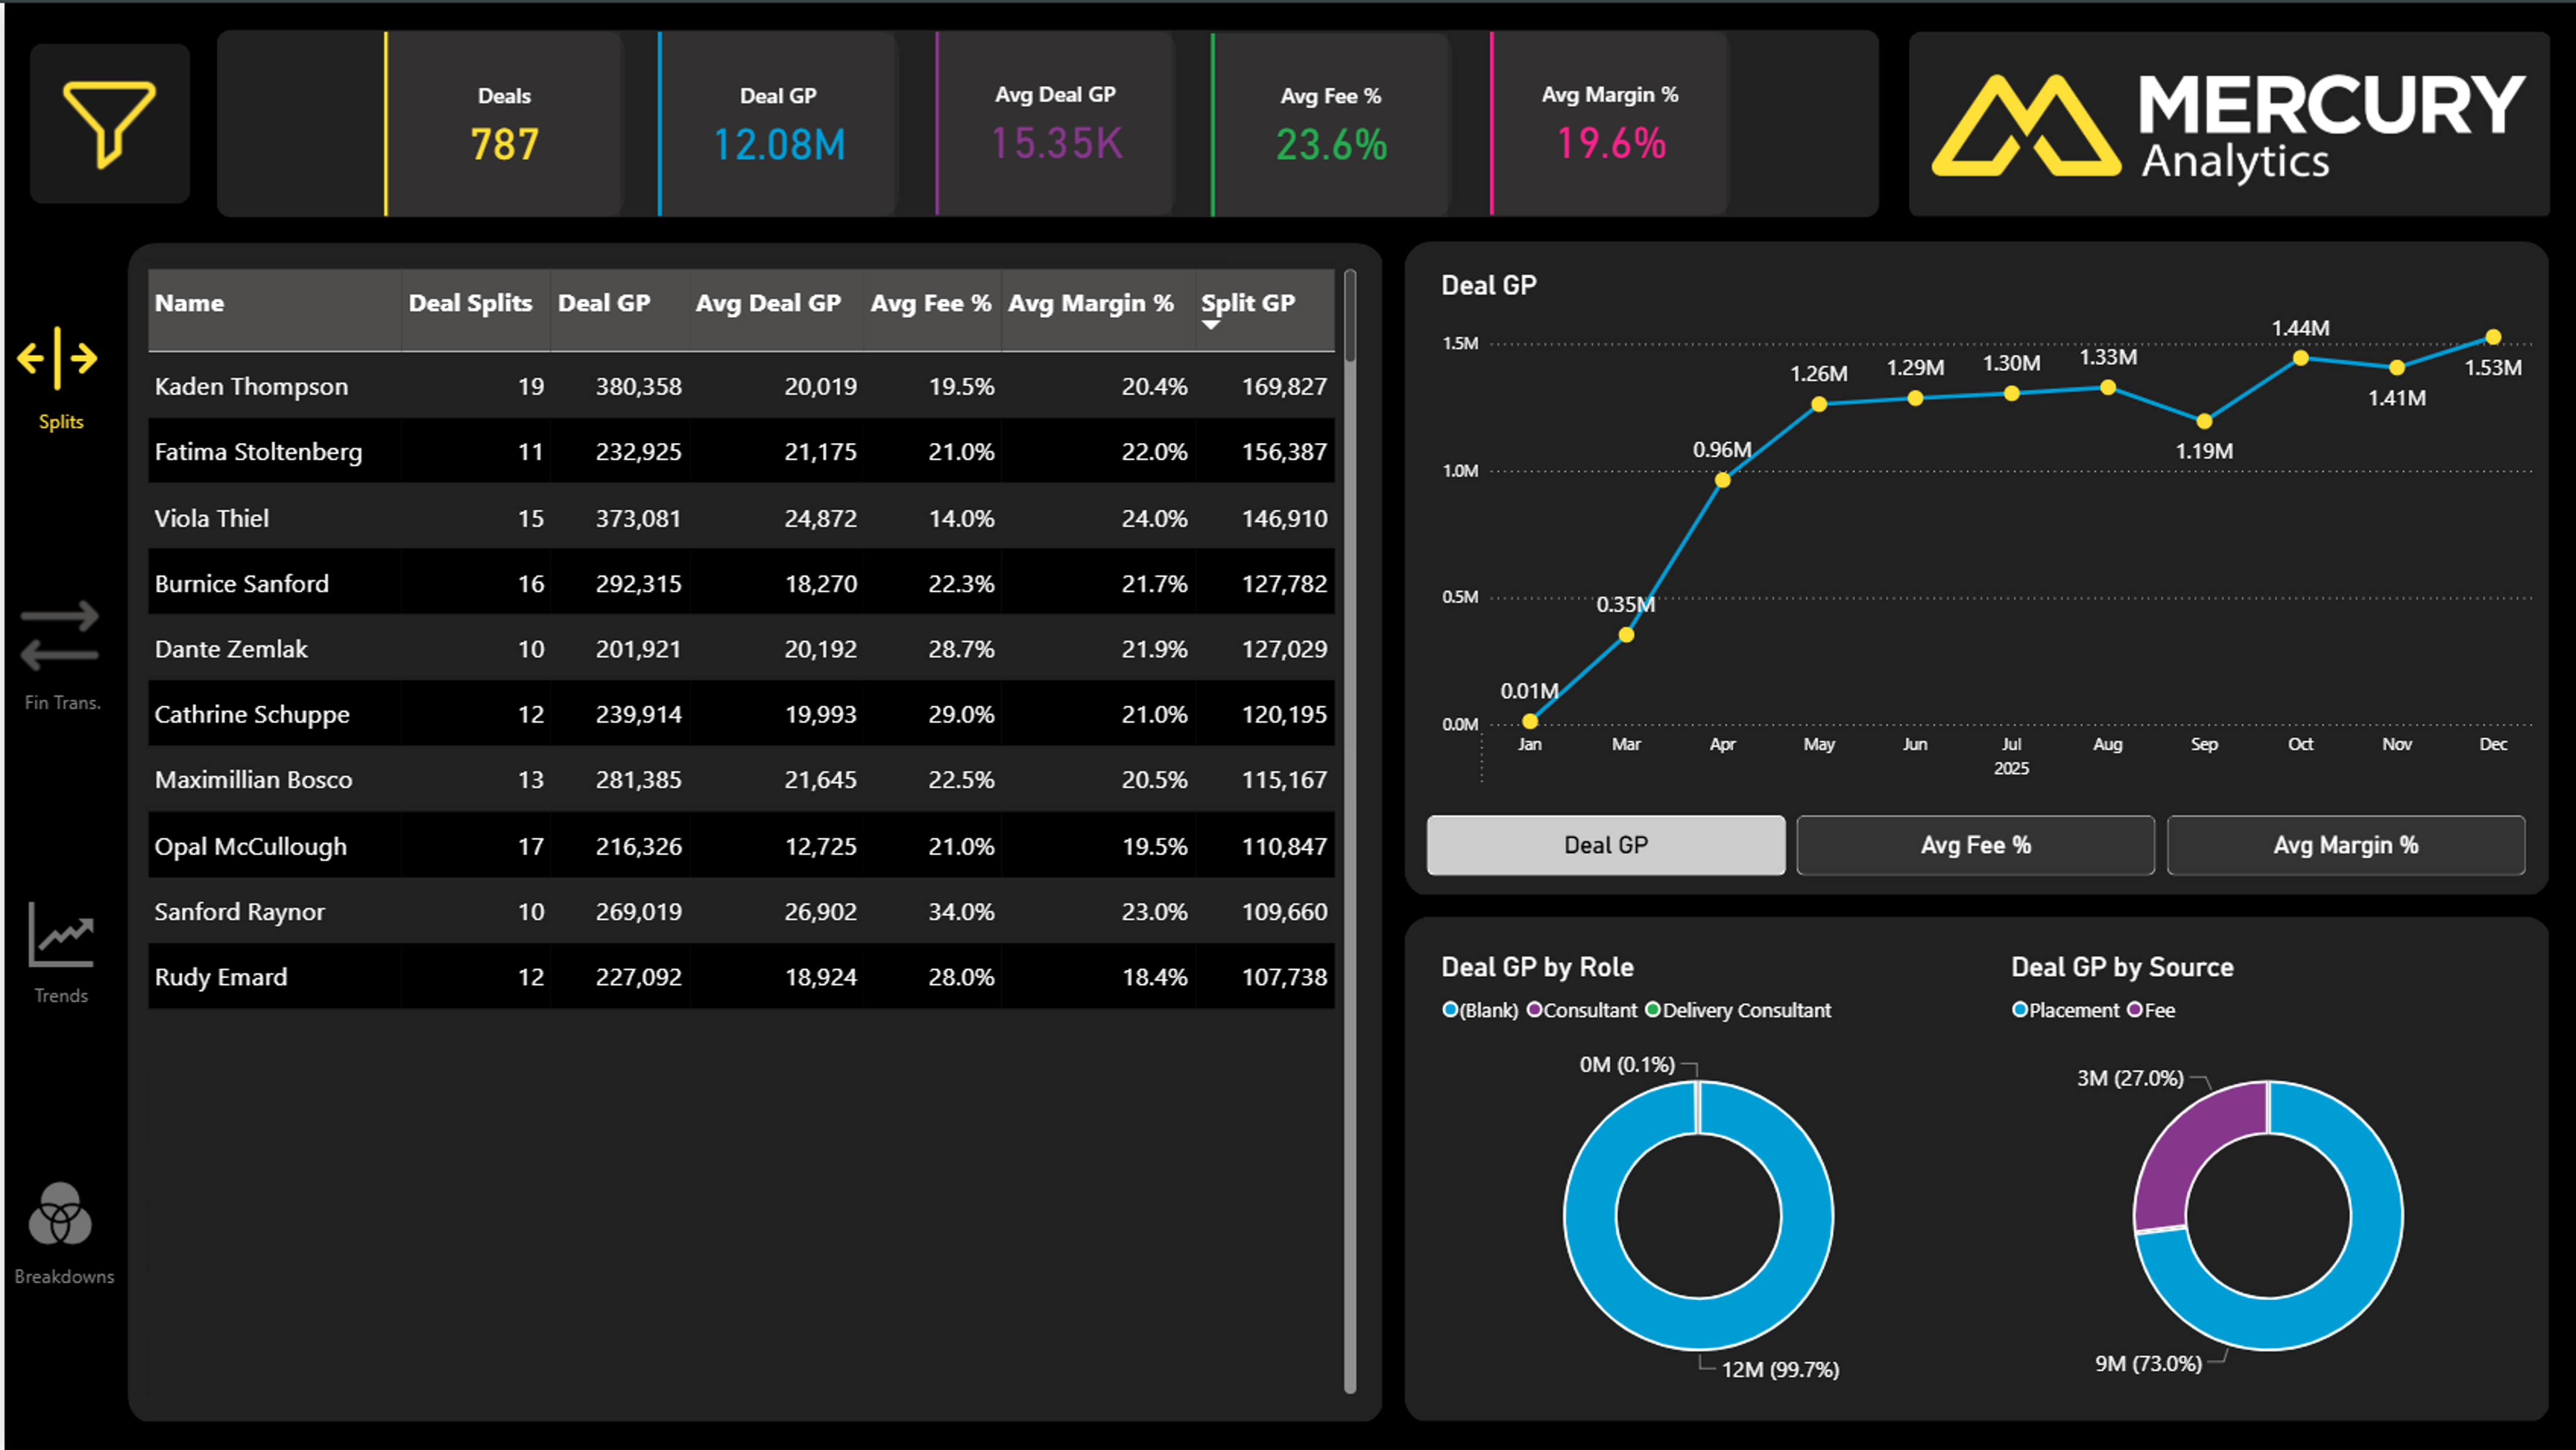
Which clients and consultants generate consistent, high quality GP versus volatile or low margin revenue?
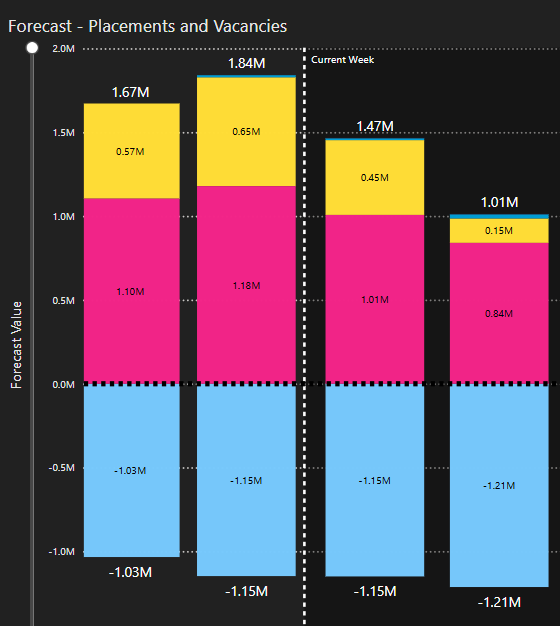
Forecast Report
Understand future Gross Profit by combining placements, vacancies, and potential extensions in one view. Act early on cash flow, market shifts, and growth opportunities.
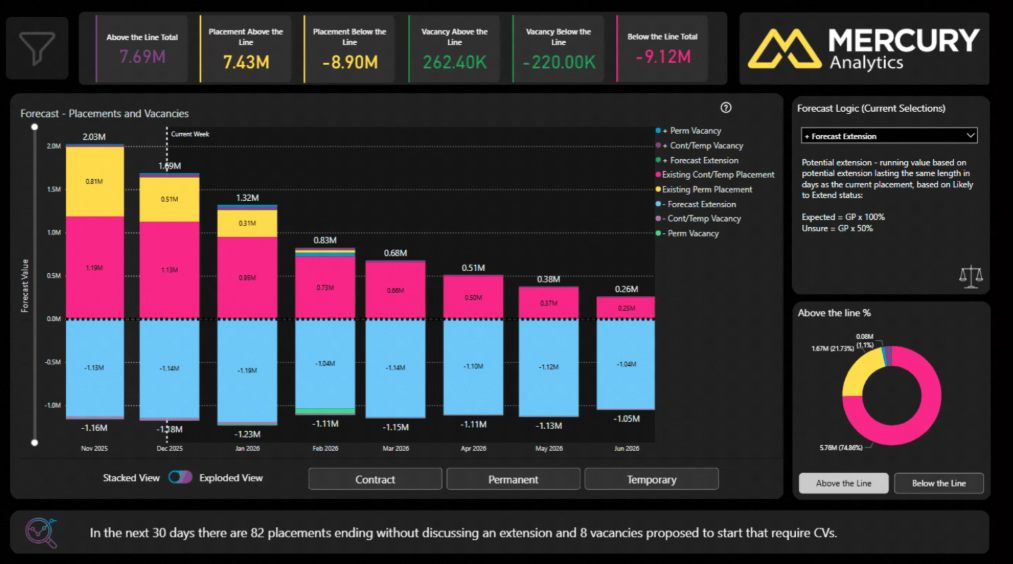
What does future revenue look like and what steps can be taken now to secure and strengthen forecasted GP?
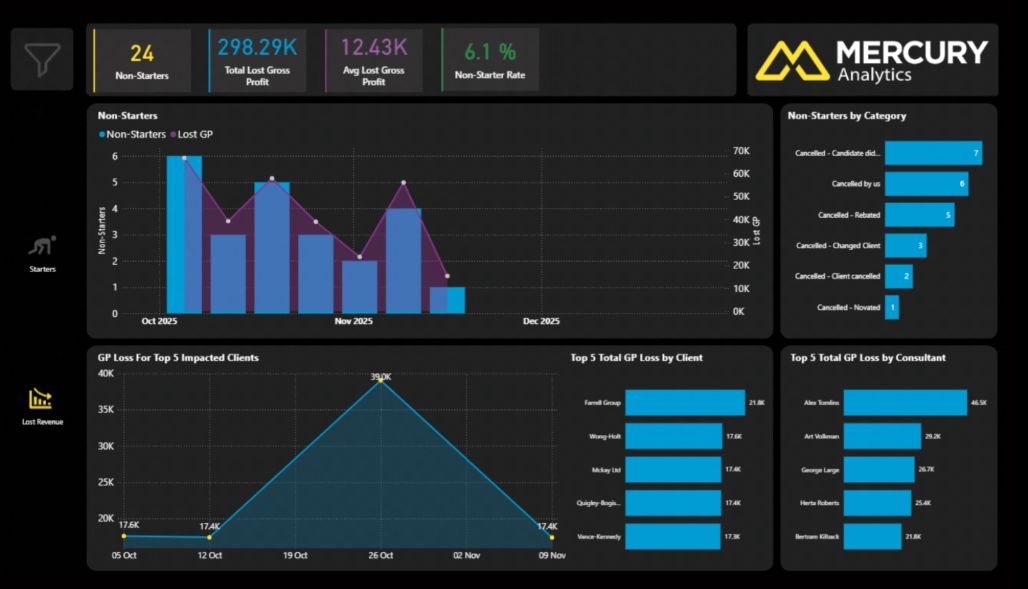
Lost Revenue Report
See where profit is leaking from contract non-starters and early terminations.. Identify root causes, intervene early, and protect profitability.
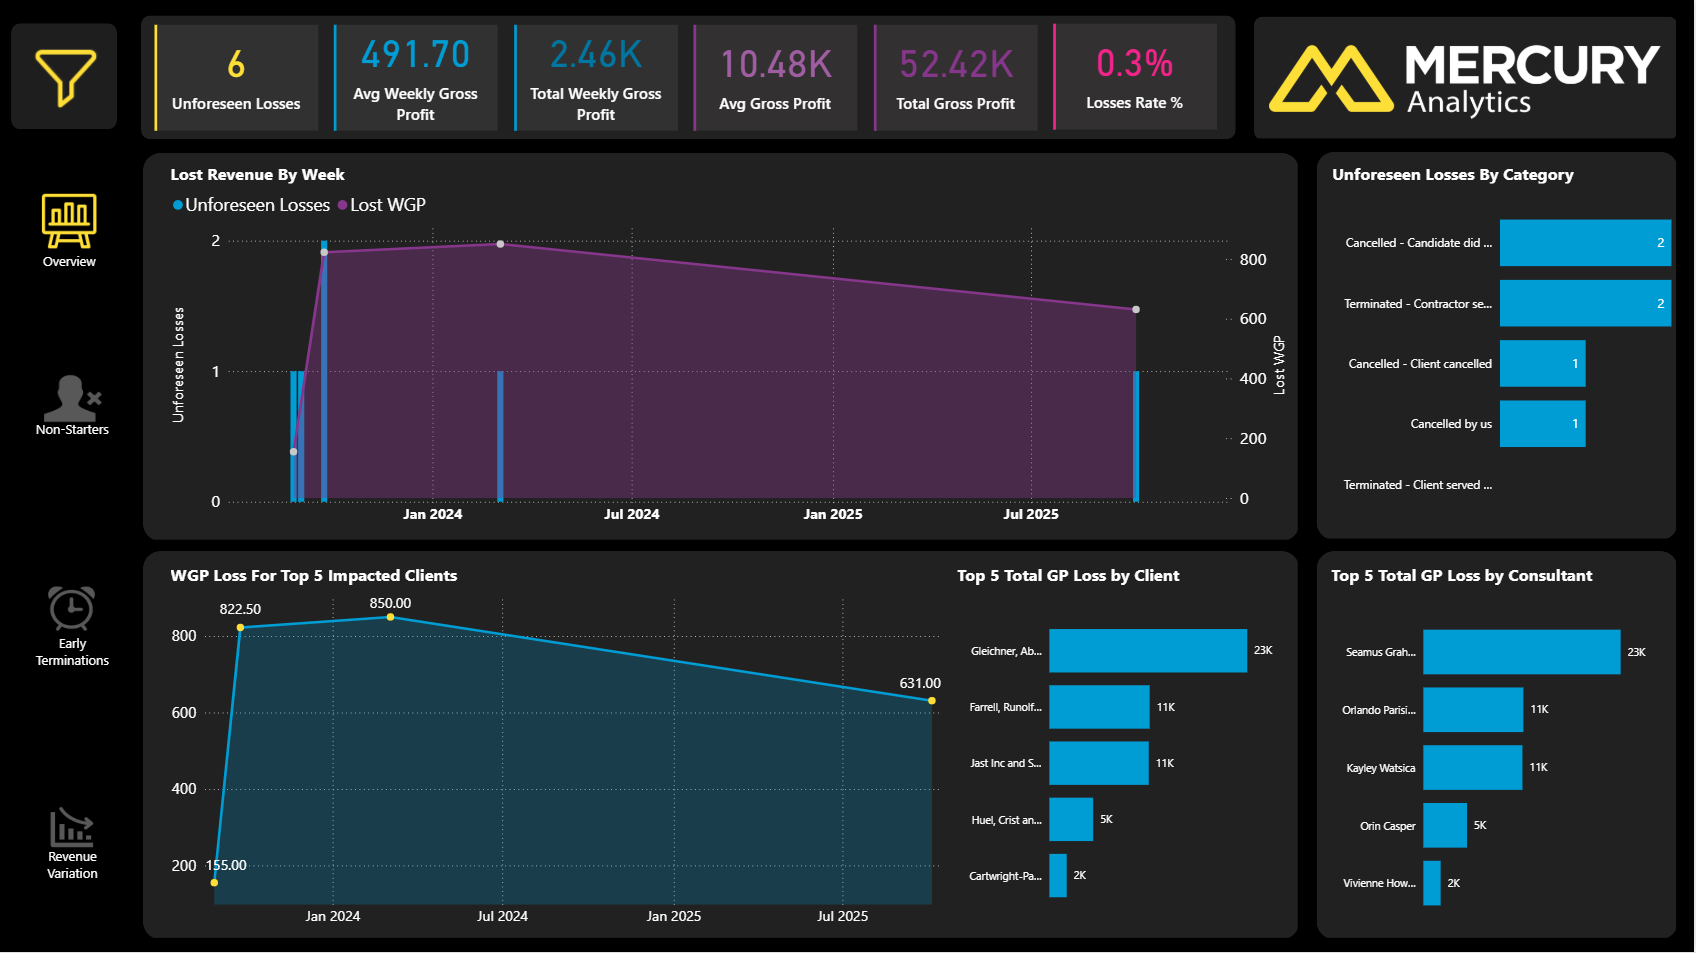
Where profit is leaking week by week and which root causes, if fixed, would recover the most GP fastest?
Temp & Contractor
Contract Starters Report
Understand the financial impact of new contract and temporary starters, with visibility to Weekly Gross Profit and Total GP . Spot bottlenecks, reduce dropouts and focus efforts on the work delivering the greatest return.
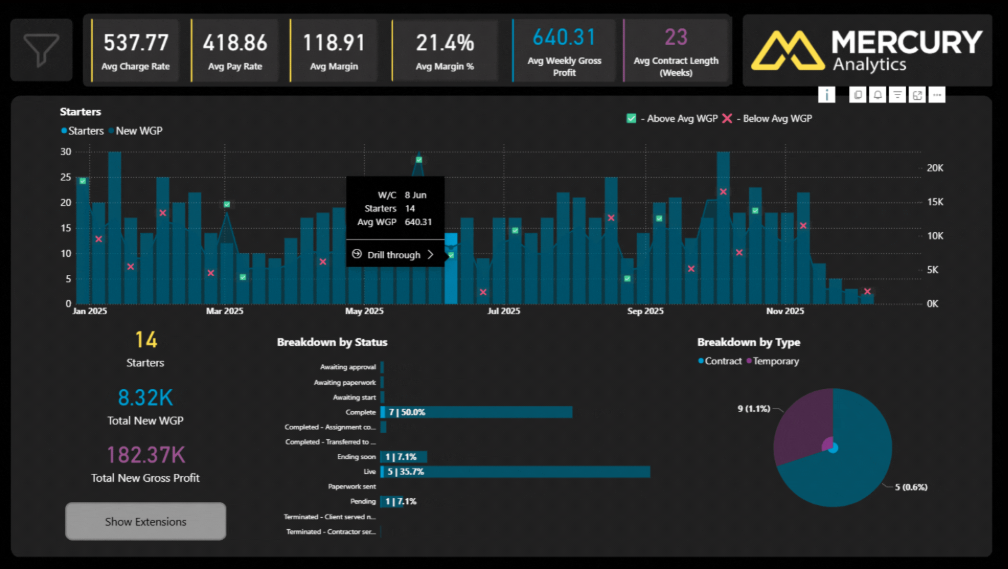
Which contract starts generate the strongest weekly GP, and which stall before they ever deliver value?
Contract Runners Report
Understand the financial performance of your active contract workforce, with runner volumes and Gross Profit across the current month, last month, and the past 12 months.
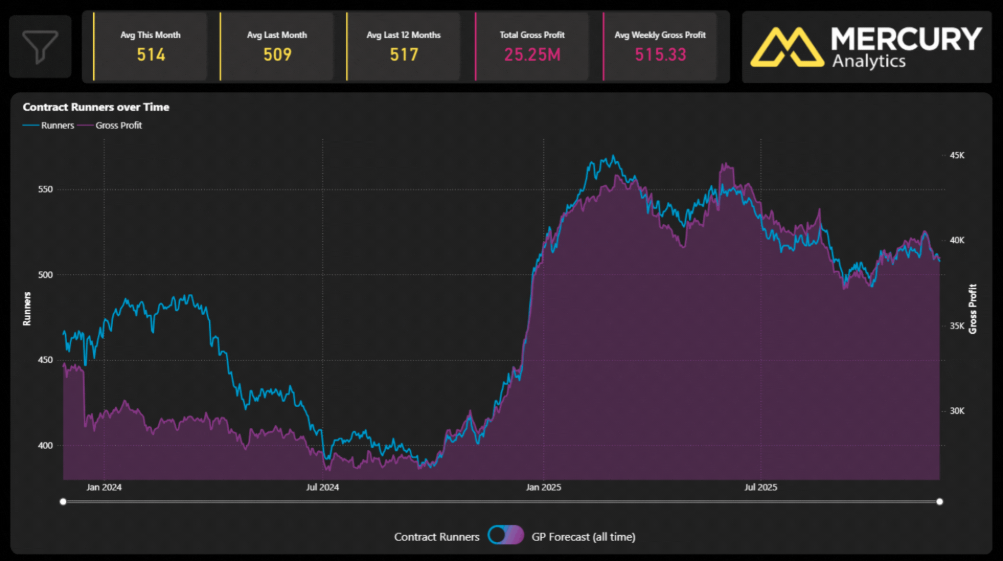
How are contract placements converting into GP and what does the next 6 months of activity tell us about sustainability?
Contract Finishers Report
See contract roles ending soon, and the Gross Profit at risk. Take action early to protect revenue, coach consultants and prevent GP leakage.
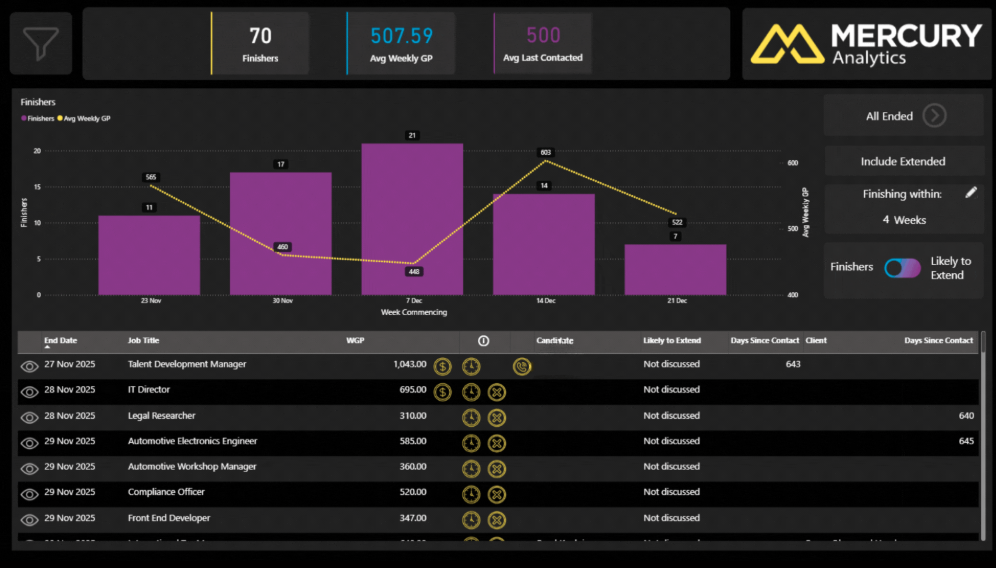
Which contracts must be extended this week to protect revenue and where do redeployment opportunities exist?
This is how data becomes part of how you operate, not something reviewed once a month.
When recruiters can see how their activity connects to outcomes, behaviour changes
Mercury Analytics helps individuals understand where to focus their time, managers identify coaching opportunities early, and leaders remove friction from processes before it impacts results. It supports better conversations, clearer priorities, and more consistent performance across the business.
Turn your data into power.
Book a personalised walkthrough and see how clearly your business can perform.